


ABSTRACT
Dust at the midplane of a circumstellar disk can become gravitationally unstable and fragment into planetesimals if the local dust-to-gas ratio μ0 ≡ ρd/ρg is sufficiently high. We simulate how dust settles in passive disks and ask how high μ0 can become. We implement a hybrid scheme that alternates between a one-dimensional code to settle dust and a three-dimensional shearing box code to test for dynamical stability. This scheme allows us to explore the behavior of small particles having short but non-zero stopping times in gas: 0 < tstop≪ the orbital period. The streaming instability is thereby filtered out. Dust settles until Kelvin-Helmholtz-type instabilities at the top and bottom faces of the dust layer threaten to overturn the entire layer. In this state of marginal stability, μ0 = 2.9 for a disk whose bulk (height-integrated) metallicity Σd/Σg is solar—thus μ0 increases by more than two orders of magnitude from its well-mixed initial value of μ0,init = Σd/Σg = 0.015. For a disk whose bulk metallicity is 4× solar (μ0,init = Σd/Σg = 0.06), the marginally stable state has μ0 = 26.4. These maximum values of μ0, which depend on the background radial pressure gradient, are so large that gravitational instability of small particles is viable in disks whose bulk metallicities are just a few (≲4) times solar. Our result supports earlier studies that assumed that dust settles until the Richardson number Ri is spatially constant. Our simulations are free of this assumption but provide evidence for it within the boundaries of the dust layer, with the proviso that Ri increases with Σd/Σg in the same way that we found in Paper I. Because increasing the dust content decreases the vertical shear and increases stability, the midplane μ0 increases with Σd/Σg in a faster than linear way, so fast that modest enhancements in Σd/Σg can spawn planetesimals directly from small particles.
Export citation and abstract BibTeX RIS
1. INTRODUCTION
Dust can settle quickly in gaseous protoplanetary disks. In a passive (non-turbulent) nebula, a particle's vertical height z above the midplane obeys

where the first term on the right-hand side accounts for gas drag and the second term accounts for stellar gravity when z ≪ r, the cylindrical radius. Here, ΩK is the Keplerian orbital frequency and

is the momentum stopping time of a particle of mass m moving at speed vrel relative to gas. Expressions for the drag force FD can be found in Adachi et al. (1976) and Weidenschilling (1977). We are interested in small, well-coupled particles having non-zero stopping times much shorter than the dynamical time: 0 < τs ≡ ΩKtstop ≪ 1. Spherical particles of radius s and internal density ρs that experience Epstein drag (FD ∝ s2vrel so that tstop does not depend on vrel) settle to the midplane at terminal velocity −Ω2Kztstop in a time

For this and all other numerical evaluations in this paper, we use a background disk that is F times more massive than the minimum-mass nebula of Chiang & Youdin (2010, hereafter CY10; see Appendix A). For such a disk, tsettle is nearly independent of stellocentric distance. The assumption that particles are spherical may not be too bad because fractal aggregates of grains are expected to become more compact as they collide with one another (Dominik & Tielens 1997; Dullemond & Dominik 2005; Ormel et al. 2007).
For millimeter-sized particles, the settling time tsettle is much shorter than the disk lifetime, measured in Myr (Hillenbrand 2005; Hernández et al. 2008). By comparison, micron-sized and smaller particles stay suspended at least one scale height above the midplane as long as the gas disk is present. To the extent that collections of particles of different sizes tend to place their mass at the upper end of the size distribution and their surface area at the lower end, we can expect most of the solid mass in disks to sediment out into a thin sublayer, leaving behind the smallest of grains to absorb incident starlight in a flared disk atmosphere. On the whole this picture is consistent with observed spectral energy distributions of T Tauri disks, although some models hint that large grains might remain lofted up in a disk two gas scale heights thick (D'Alessio et al. 2006). Settling can only proceed when and where disk turbulence dies, in regions where gas is insufficiently dense to sustain gravitoturbulence (Gammie 2001) and too poorly ionized to be magnetorotationally unstable (Gammie 1996). Our current understanding of disk turbulence easily admits such passive disk regions, located at disk midplanes where ionizing radiation from the star cannot penetrate (Perez-Becker & Chiang (2010). Turner et al. (2010) found in numerical simulations that even when disk surface layers were magnetorotationally unstable, grains at the midplane settled much as they would in a laminar flow.
In passive disk regions, how far down do dust particles settle? When particles are small enough not to be affected by aerodynamic streaming instabilities (SIs; e.g., Bai & Stone 2010a), we expect them to settle until the dust density gradient ∂ρd/∂z becomes so large and the consequent vertical shear in orbital velocity ∂vϕ/∂z becomes so strong that the sublayer is on the verge of overturning by a Kelvin–Helmholtz-type instability (KHI; Weidenschilling 1980). An order-of-magnitude estimate of the minimum layer thickness can be derived using the Richardson number

which if less than some critical value Ricrit may signal that the layer is KH unstable (e.g., Drazin & Reid 2004). Here, g is the vertical gravitational acceleration and ρ = ρd + ρg is the total density of dust plus gas. In Lee et al. (2010, hereafter Paper I), we found that Ricrit increases with Σd/Σg, the ratio of dust-to-gas surface densities, a.k.a. the bulk metallicity. For disks of bulk solar metallicity, we determined empirically that Ricrit ≈ 0.2.
To translate the Richardson number (Equation (4)) into a critical dust layer thickness, first recognize that the orbital velocity vϕ depends on the local dust-to-gas ratio μ ≡ ρd/ρg according to

in the inertial frame, where

is a dimensionless measure of the strength of the background radial pressure gradient ∂P/∂r, with gas scale height Hg and sound speed cs (e.g., Nakagawa et al. 1986). When ∂P/∂r < 0, pressure provides extra support against radial stellar gravity and so drives the gas to move on slower than Keplerian orbits. The orbital velocity depends on μ as in Equation (5) because dust-laden gas, weighed down by the extra inertia of solids, is accelerated less by the radial pressure gradient than is dust-free gas, and so must hew more closely to Keplerian rotation. Call the critical layer height ΔzRi for which Ri = Ricrit, and assume the midplane gas-to-dust ratio μ0 ≳ 1 (above the layer μ ≪ 1). Then evaluating Equation (4) with the approximations g ≈ −Ω2KΔzRi (no self-gravity), ρ−1∂ρ/∂z ∼ −1/ΔzRi, and ∂vϕ/∂z ∼ −ηΩKr/ΔzRi, we find

Equation (7) indicates that the dust layer could be quite thin, subtending on the order of 1% of the gas scale height. Is this thin enough for the dust to self-gravitate and hopefully fragment into planetesimals? One can compare the midplane density to the "Toomre density" required for the disk to undergo gravitational instability on the dynamical time Ω−1K (Safronov 1969; Goldreich & Ward 1973).5 As reviewed by CY10, the Toomre density is6

where the numerical evaluation is for a central stellar mass M* equal to 1 M☉. Now the actual midplane (subscript 0) density is

which means the midplane dust-to-gas ratio must be

for the midplane density to match the Toomre density. By comparison, in our crude model of a dust sublayer whose height above the midplane cannot be smaller than ΔzRi, the midplane dust-to-gas ratio cannot exceed

which is nominally smaller than μ0,Toomre by more than an order of magnitude. Here the bulk (height-integrated) metallicity Σd/Σg is normalized to solar abundance (Lodders 2003), assuming all metals have condensed into grains.7
For many years, the fact that μ0,Ri falls short of μ0,Toomre was believed to rule out the formation of planetesimals by collective effects, self-gravitational or otherwise (e.g., Weidenschilling & Cuzzi 1993), but there are more ways to achieve the Toomre density than vertical settling. A dissipative form of gravitational instability can, in principle, collect particles radially into overdense rings even when self-gravity is weaker than stellar tidal forces (Ward 1976, 2000; Coradini et al. 1981; Youdin 2005; for a simple explanation of the instability, see the introduction of Goodman & Pindor 2000). It is not clear whether this instability, which operates over lengthscales and timescales longer than those characterizing the Toomre instability by at least a factor of (μ0,Toomre/μ0)2, can compete with other effects that seek to rearrange dust and gas (e.g., Youdin 2005).
Another alternative is to invoke larger dust particles that are only marginally coupled to gas; these can clump by the aerodynamic SI (Youdin & Goodman 2005; Johansen et al. 2009; Bai & Stone 2010a, 2010c). In their three-dimensional (3D) numerical simulations, Johansen et al. (2009) reported that particles having τs = 0.1–0.4—corresponding to sizes of a few centimeters at r = 5 AU if F = 1, and larger sizes if F>1—concentrated so strongly by aerodynamic effects that planetesimals effectively hundreds of kilometers across coalesced within just a few orbits. To obtain this result, Johansen et al. (2009) initialized their simulations by placing the bulk of the disk's solid mass into particles approaching decimeters in size. Bai & Stone (2010a) greatly expanded the range of τs modeled and found similar results for their 3D simulations: in the highly turbulent states driven by the SI, instantaneous densities exceeded the Roche density8 when the disk's solids were all composed of particles having τs = 0.1–1 and the bulk height-integrated metallicity was about twice solar; see run R10Z3-3D in their Figure 5. For this same run, the time-averaged dust-to-gas ratio at the midplane was ∼12, a factor of a few less than the Toomre threshold; see their Figure 4 and compare with our Equation (10). By contrast, when half or more of the disk's solid mass had τs < 0.1, or when disks had smaller metallicities, their simulated densities fell short of the Roche and Toomre densities by more than an order of magnitude. Note that we are quoting from the 3D simulations of Bai & Stone (2010a).
Given how sensitive the SI is to the existence of marginally coupled particles (centimeter to meter sized for τs ∼ 0.1–1, r ∼ 1–30 AU, and order unity F), whether enough such particles actually exist in protoplanetary disks for the SI to play a dominant role in planetesimal formation remains an open and delicate issue. Appeal is often made to observed spectral energy distributions and images of T Tauri disks at centimeter wavelengths; these suggest that much of the solid mass is in millimeter-to-centimeter sized particles (e.g., D'Alessio et al. 2001; Wilner et al. 2005). Larger-sized particles are plausibly also present but are not inferred for want of data probing the disk at longer wavelengths. One problem concerns how quickly τs ≳ 0.1 particles can be grown, and how they can survive orbital decay by gas drag. In the 3D simulations of Bai & Stone (2010a), the SI clumped particles strongly enough for self-gravity to be significant when τs ≳ 0.1 particles comprised more than half of the disk's solid mass. It is unclear whether particle–particle sticking can build up such a population before it is lost to the star by gas drag. This concern is ameliorated by enhancements in particle density (pileups) that may occur as particles drift radially inward (Youdin & Shu 2002; Youdin & Chiang 2004), and by the reduction of drift speeds brought about by multiple particle sizes (Bai & Stone 2010a, see their Figure 8).
Regardless of which scenario nature prefers—particle concentration by the SI; dissipative gravitation into rings; or dynamical collapse of a vertically settled sublayer, which is the subject of this paper—all the proposed ways of forming planetesimals depend on knowing how far down dust settles and what maximum dust-to-gas ratios μ0 can be attained at the midplane. Our order-of-magnitude estimate in Equation (11) requires testing. Among the most realistic simulations of particle settling are those by Johansen et al. (2009) and Bai & Stone (2010a), both of which concentrated on the SI. Johansen et al. (2009) reported that super-centimeter-sized particles settled into sublayers in which the midplane-averaged μ0 ranged from 0.6 to 9.0 as the bulk metallicity ranged from 1 to 3× solar. Bai & Stone (2010a) found that the highest τs particles settled the most, driving turbulence that lofted smaller τs particles to greater heights. They argued that in their simulations, all of which were characterized by max τs ⩾ 0.1, particles were so strongly stirred by the SI that the KHI never manifested.
To complement these studies, we would like to understand the settled equilibrium states of disks composed entirely of small particles, well but not perfectly coupled to gas (0 < max τs ≪ 1), isolated from the complicating effects of the SI but not other instabilities like the KHI. Some previous attempts in this regard relied on assumed forms for the density profile of settled dust. Barranco (2009) presumed the dust density profile was Gaussian in shape, and did not seek to determine the maximum value of μ0 per se. Chiang (2008) and Paper I, following Sekiya (1998) and Youdin & Shu (2002), assumed the dust density profile had a spatially constant Richardson number. We found in Paper I that under this assumption, in a disk of bulk solar metallicity (Σd/Σg = 0.015), the sublayer could remain KH stable for μ0 as high as 8—a value that is nearly an order of magnitude higher than our crude estimate in Equation (11), and as such lowers the hurdle to forming planetesimals by gravitational instability.
Weidenschilling (2006, 2010) did not assume a shape for the marginally stable density profile to which dust relaxes. Instead the profile was calculated from a one-dimensional (1D) model that balanced the downward flux of particles by gravity (including vertical self-gravity) with the upward flux due to turbulent diffusion. The model used prescriptions for KH turbulence, with a number of parameters chosen to match the 3D calculations of Cuzzi et al. (1993)—which also relied on a prescribed form of the turbulence. Weidenschilling (2006) found that the density of millimeter-sized particles could exceed the Toomre density at r = 3 AU in a disk approximately 1.3× as massive as our minimum-mass solar nebula, and whose bulk metallicity Σd/Σg = 0.054 ≈ 3.6× solar. See his Figure 10, but note that 3.6× solar metallicity ≈16× his "nominal" abundance of solids, and that his "critical" density is 3× larger than our Toomre density.
Like Weidenschilling (2006, 2010), we seek the marginally stable state to which dust settles, in the limit that particles are well but not perfectly coupled to gas (0 < τs ≪ 1). We improve upon these earlier studies by not prescribing or parameterizing the turbulence, but by letting turbulence arise and evolve naturally from our 3D integrations of the standard fluid equations. In particular, our work is free of the popular but untested assumption that dust settles until the Richardson number equals a constant everywhere. We allow dust grains to fall until they are stopped by whatever instabilities they self-generate. In the calculations presented here we assume that dust begins well mixed with gas in a Gaussian density profile, and then follow the dust into whatever non-Gaussian distribution it seeks to relax. Although we try only a Gaussian initial profile, our method accommodates arbitrary initial conditions.
At the heart of our approach lie two codes. The first code is in one dimension (z) and computes the vertical drift of dust grains at their terminal velocities. Though incapable of deciding whether the density profiles it generates are prone to the KHI (or any other instability), the 1D code can evolve dust profiles for the entire settling time tsettle, which can be arbitrarily long for arbitrarily small grains. The task of assessing stability is reserved for the second code: the spectral, anelastic, shearing box code of Barranco (2009) which treats gas and dust in the perfectly coupled τs = 0 limit. Though incapable of allowing dust to settle out of gas, the 3D code accounts for the complicated interplay of vertical shearing and rotational effects to decide whether a given dust layer overturns from the KHI (or some other instability). It tests dynamical stability by running for dozens of dynamical times tdyn = Ω−1K. Our procedure involves alternating between these two codes: allowing dust to settle over some fraction of the settling timescale tsettle using the 1D code; passing the results of the 1D code to the 3D code and allowing the dust profile to relax dynamically over timescales tdyn; passing the results of the 3D code back to the 1D code for further sedimentation on the settling timescale; and so on, back and forth, until the midplane dust-to-gas ratio stops increasing, at which point the marginally stable state is identified.
In Section 2 we describe our method in full. Results are presented in Section 3, extended in Section 4, and summarized and discussed in Section 5.
2. METHOD
As sketched in Section 1, to find the marginally stable state to which small dust grains relax, we alternate between two codes: a 1D code that tracks how dust drifts toward the midplane on the settling timescale tsettle and a 3D shearing box code developed by Barranco (2009) that allows dusty gas to stabilize on the dynamical timescale tdyn ≪ tsettle. The 3D code integrates the anelastic fluid equations for perfectly coupled dust and gas using a spectral method. It includes a background radial pressure gradient to drive a vertical shear. Details about the 3D code are in Barranco & Marcus (2006), Barranco (2009), and Paper I.
Dust and gas are initially well mixed with a spatially constant density ratio: [ρd(z)/ρg(z)]init ≡ μinit = constant. We set μinit equal to either solar metallicity (μinit = 0.015; Lodders 2003; see also footnote 7) or four times solar metallicity (μinit = 0.06). To determine the initial form of the dust density profile ρd(z), we solve the equation for vertical hydrostatic equilibrium where gas is assumed to be initially isothermal:

whence

for constants μinit, a characteristic initial height Hg ≡ cs/ΩK, and the midplane gas density ρg0.
Taking μinit to be constant over all gas scale heights is a simplifying but probably unrealistic assumption. Even if particles of fixed size s carry the bulk of the disk's solid mass, such particles would not likely begin well mixed with gas everywhere. Densities at altitude may be too low to permit particles of size s to coagulate, and to keep such particles aloft once formed. Nevertheless, the error accrued by our assumption of constant μinit is small insofar as increasingly small amounts of mass are contained at larger altitudes. Moreover, we will find evidence that the final marginally stable state to which dust relaxes is insensitive to initial conditions (Section 5.1). In any case, we will point out in Section 3 which features of the evolving dust profile are artifacts of our assumed initial condition.
Equation (13) defines the initial dust profile used by the 1D code, whose grid extends from z = 0 to z = 3Hg. The 1D Lagrangian code uses particles to track the motion of dust mass. Each particle represents the same amount of dust mass. Any dust density profile ρd(z) can be converted into particle positions and back again. The closer particles are spaced, the greater is ρd.
Starting with Equation (13), we proceed as follows.
- 1.
- 2.1D code: Settle dust particles by one timestep Δt. By equating the vertical gravitational force ∝z to the Epstein drag force FD ∝ ρgvrel (e.g., Weidenschilling 1977), assign terminal velocitiesto each particle. Advect each particle vertically downward by a distance vrelΔt, where Δt is chosen small enough that particles do not overtake one another. Note that the coefficient of proportionality on the right-hand side of Equation (14), which depends on quantities such as the disk mass parameter F and grain properties s and ρs, does not affect the shapes of the density profiles generated so long as it is the same for all particles.Bin particle positions and recalculate ρd(z).

- 3.1D code: Repeat steps (1) + (2) until the midplane dust density ρd(0) rises by 30%.
- 4.1D → 3D code: Insert results of the 1D code into the 3D code and run the 3D code for 10 orbits. Let zmax be the position of the highest particle in the 1D code, and set the dimensions of the shearing box in the 3D code to be (Lr, Lϕ, Lz) = (1.455, 2.91, 4)zmax, resolved by (Nr, Nϕ, Nz) = (32, 64, 128) gridpoints.10 Initialize the 3D code by assigning μ(z), as calculated by the 1D code, to each horizontal gridpoint (r, ϕ).11 The 3D code initializes the remaining variables—velocity, gas density, temperature, and enthalpy—to ensure dynamical equilibrium; see Section 2.2 of Paper I.The background radial pressure gradient is parameterized by the variable vmax:We fix vmax = 0.025cs for all simulations. Physically, vmax ∼ c2s/(ΩKr) represents the difference in azimuthal velocity between pressure-supported dust-free gas and a strictly Keplerian flow.12Before running the 3D code, perturb μ(r, ϕ, z) by an amountwhere A(r, ϕ) is a random variable constructed in Fourier space (see the discussion following Equation (31) of Paper I). Fix the root mean square of the perturbations to be Arms ≡ 〈A2〉1/2 = 10−3.Run the 3D code for 10 orbits.
- 5.3D code: Assess stability. Extend simulations beyond 10 orbits as necessary to make this assessment. Label the dust profile "KH-unstable" if the horizontally averaged dust-to-gas ratio at the midplanedecreases by more than 15%. Otherwise, monitor the horizontally averaged vertical kinetic energy at the midplane:If 〈μv2z〉/2 monotonically decreases or levels off, label the dust profile "KH-stable." If 〈μv2z〉/2 is increasing toward the end of the simulation, extend the integration an additional 10 orbits and re-assess stability. Repeat step (5) as necessary.
- 6.If "KH-unstable," stop. Identify the last KH-stable dust profile, generated in the iteration just previous to that of the KH-unstable simulation, as the "marginally stable state."13
- 7.If "KH-stable," pass results of the 3D code back to the 1D code and return to step (1). Fit a polynomial μpoly(z) to the final, horizontally averaged dust-to-gas ratio 〈μ(z)〉 as calculated by the 3D code. Adjust the order of the polynomial to capture all features of the profile. If one polynomial is insufficient, use two to create a piecewise function. Convert μpoly(z) to ρd(z) by assuming the gas profile to be Gaussian (see footnote 9): ρd(z) = μpoly(z) · ρg0exp [ − z2/(2H2g)]. Using this ρd(z), return to step (1) for the next iteration.


Our method and results apply to any location in a disk of any mass (arbitrary r and F), provided our input assumptions that self-gravity is negligible and vmax/cs = 0.025 are satisfied. They also apply to any particle size to the extent that the disk's solid mass is concentrated in particles of a single size (so that z and ρg uniquely determine vrel; Equation (14)), and to the extent that such particles are undisturbed by SIs (Sections 1 and 5.3). Another way of saying all this is to note that our calculations are carried out in dimensionless units.
3. RESULTS
To orient the reader, in Figure 1 we show results obtained from the 1D code only. The dust is initially well mixed with gas at solar metallicity (μinit = 0.015). As dust settles and the midplane dust-to-gas ratio μ0 increases, sharp cusps appear at the edges of the dust layer where particles pile up vertically. Pileups occur because particle fluxes ρd|vrel| ∝ μ|z| increase with increasing height |z|. This follows from our assumption that μinit is constant, which as noted at the beginning of Section 2 may not be realistic.

Figure 1. Snapshots of settling dust computed with the 1D code only. Plotted is the dust-to-gas ratio as a function of height at various instants of time. Relative timestamps are assigned by the non-dimensional parameter f; see the inset equation for the absolute elapsed time, which assumes ρs = 1 g cm−3 and F = 1 (Equation (3)). Note that the shapes of these profiles and their relative spacing in time are independent of the absolute elapsed time, and thus independent of ρs, F, and s. At f = 0, dust begins well mixed at solar metallicity (μ = 0.015; Lodders 2003). By f = 0.054, a pileup has formed at the dust layer's edge. The pileup is an artifact of our assumption that the initial dust-to-gas ratio μinit is constant everywhere, which causes particle fluxes ρd|vrel| ∝ μ|z| to decrease with decreasing height |z|.
Download figure:
Standard image High-resolution imageUnlike us, Garaud & Lin (2004) did not find vertical pileups at the edges of their layer because they chose their initial dust profile to have a scale height equal to 0.1Hg. Their initial μ profile decreased with |z| more quickly than 1/|z|, and thus did not satisfy the condition for pileups. We verified this by inserting their initial profile into our 1D code.
The shapes of the settled dust profiles μ(z) and their relative spacing in time are independent of the dust internal density ρs, dust particle size s, and the scaling parameter F for disk mass. Changing these parameters only alters the absolute physical time elapsed (Equation (3)). Relative time is tracked by the dimensionless parameter f ≡ t/tsettle, labeled on this and many subsequent figures.
Below we compare these 1D-only results to those that include the full 3D dynamics. The solar metallicity case is described in Section 3.1. The metal-rich case (μinit = 0.06) is presented in Section 3.2.
3.1. Solar Metallicity
Figure 2 traces the evolution of dust that starts well mixed with gas at solar metallicity. Plotted are several KH-stable curves from the 3D code resulting from step (5) of our procedure. For ease of comparison with the purely 1D results, the relative timestamps in Figure 2, measured by f, coincide with those in Figure 1. The leftmost curve at f = 1.0 represents the marginally stable state identified using our standard procedure. This state achieves a midplane dust-to-gas ratio of μ0 = 2.45, about an order of magnitude below the value required for gravitational instability (Equation (10)). In Section 4, we extend our procedure to see if we might achieve still higher dust-to-gas ratios.

Figure 2. Snapshots of settling dust computed using the standard procedure of Section 2 which combines the 1D and 3D codes, for the case of bulk solar metallicity. Elapsed time is marked by f; plotted values coincide with those in Figure 1. The shapes of the profiles and their relative spacing in time do not depend on the absolute elapsed time; they are independent of ρs, F, and s. Dust begins well mixed with gas at μ = 0.015 and ends in the marginally stable state with midplane μ0 = 2.45. Vertical gridpoints from the 3D code are plotted as dots. In comparison to the purely 1D results of Figure 1, the pileup at the layer's edge is smoothed away, probably by the Rayleigh-Taylor instability, between f = 0.22 and f = 0.65. Except for transferring some dust at altitude to the midplane, the instability leaves the midplane relatively unaffected, which until f = 1.0 evolves much as it does in Figure 1.
Download figure:
Standard image High-resolution imageComparing Figures 1 and 2, we see that the (possibly unrealistic) pileups at the edges of the dust layer do not survive in the dynamical 3D code. By f ≈ 0.44, the pileups are nearly gone. At this point, the vertical extent of the dust layer zmax has shrunk to ∼0.1Hg, and the only pileup present is the one at the midplane.
The instability that eliminates the pileups at the edges of the layer is likely related to the Rayleigh–Taylor instability (RTI), triggered by heavy fluid lying on top of lighter fluid, and we will refer to it henceforth as such. The RTI originates locally at the edges of the dust layer. By contrast, the midplane is relatively stable (at least until the marginally stable state is reached). Another way of seeing this is to note that midplane dust-to-gas ratios μ0 in Figures 1 and 2 agree to within 25%. Closer examination reveals that those in Figure 2 are consistently higher. This suggests that the RTI transfers some of the dust in the pileups to the midplane.
Figure 3 confirms this transfer mechanism. The top middle panel shows that over the course of a 20-orbit-long 3D simulation (iteration #6, occurring at a time f = 0.31, out of a total of 19 iterations), dust is redistributed from the layer's edges to the midplane, raising μ0 by about 20%. Note that the effect of the RTI has been to transport dust toward the midplane, not to higher altitudes. The RTI is confined to where dust is unstably stratified (increasing total density in the direction opposite to gravity).

Figure 3. Two successive iterations of our procedure of Section 2, for the case of bulk solar metallicity. From left to right, the panels show a starting dust profile (black curve) settled by the 1D code until its midplane μ0 increases by 30% (red dot-dashed curve). This settled curve is then passed to the 3D code and evolved (blue curve) until it stabilizes (rightmost panel showing how the vertical kinetic energy at the midplane eventually levels off). Top panels show iteration #6 of 19 (equivalently f = 0.33 on the timeline of Figure 2). The unstably stratified pileups collapse around t ∼ 11 orbits, increasing the midplane dust content by ∼20% (top middle panel). Bottom panels show iteration #7 (f = 0.38) which begins where iteration #6 leaves off—except that the kinetic energy of the flow is reset to a low value (bottom right vs. top right panels), and the slight asymmetry in 〈μ〉 about z = 0 (top middle panel, blue curve) is dropped upon fitting a polynomial only to z ⩾ 0 (bottom left panel, black curve). The oscillations in the μ-profiles are artifacts of having too few basis functions in z. They did not seem to introduce instability, which always occurred instead at the edges of the dust layer where gradients were steepest and realistically computed.
Download figure:
Standard image High-resolution imageCompare this behavior with that in the top row of Figure 4, which documents a later iteration, #16. The top middle panel shows that an instability has occurred near the edges of the dust layer. Dust is redistributed to higher, not lower, altitudes. The midplane is not affected. The instability at this relatively late stage of settling is probably driven by the vertical shear associated with strong density gradients at the edges of the layer, and we will refer to it henceforth as the KHI. As a result of the KHI, gradients in density and velocity are reduced.

Figure 4. Similar to Figure 3 but showing iterations #16 (top) and #17 (bottom) out of a total of 19, for the case of bulk solar metallicity. In iteration #16, dusty gas at the layer's edges mixes with dust-poor gas at higher altitudes (top middle), probably by the KHI. The subsequent evolution during iteration #17 shows no sign of instability after 10 orbits.
Download figure:
Standard image High-resolution imageThe marginally stable state identified using our standard procedure is displayed in Figure 5. The bottom panels show that during the last iteration #19, the usual 30% increase in the midplane μ0 (left bottom) results in a KH-unstable profile (middle bottom). In the top panels, we re-do iteration #19, this time incrementing μ0 by only 10% (left top). The resultant profile is KH stable (middle and right top panels), and has 〈μ0〉 = 2.45. In Section 4.2, we modify our standard procedure and extend it to later times to achieve still higher dust-to-gas ratios in stable flows.

Figure 5. Similar to Figures 3 and 4 but showing the last couple iterations (#19a and #19b) which provisionally identify the marginally stable state for the case of bulk solar metallicity. Increasing the midplane dust content from iteration #18 by 30% (bottom panels) leads to a KH-unstable profile, while an increase of 10% preserves KH stability (top panels). Quadrupling Lϕ and Nϕ simultaneously (dotted lines) does not change our answer. The marginally stable state in the top panels is refined according to a modified procedure in Section 4.2.
Download figure:
Standard image High-resolution imageThe μ-profiles in Figures 2–5 betray oscillations just inside the edges of the dust layer. We believe these ripples are artificial because when each first appears, it spans only a few grid points of the 3D code: see the f = 0.054 profile of Figure 2, which shows two nascent ripples. The features probably arise because the truncated Chebyshev series used to model the flow in z has too few terms to adequately capture the steep vertical density gradient (Gibbs 1898). Originating in the 3D code, the ripples are then amplified as mini-pileups in the 1D code. We could have tried to smooth away these oscillations by reducing the order of our polynomial fit (step 7 of our procedure), but chose instead to retain all features of the dust profile generated by both codes to minimize bias. In any case the oscillations are eventually erased by instabilities during the later stages of settling (Figure 2). In and of themselves the oscillations do not appear to introduce instabilities, which as discussed above are triggered instead by smooth density gradients—realistically computed—at the boundaries of the layer (top rows of Figures 3 and 4).
3.2. Metal-rich Case: 4 × Solar Metallicity
Figure 6 follows the evolution of dust that is initially well mixed with gas at 4× solar metallicity. It shares the same timeline as Figures 1 and 2. Thus, the last profile marked f = 1.1 in Figure 6 is attained at a time 10% later than that marked f = 1.0 in the other figures. This last profile is the marginally stable state identified using our standard procedure, for the case of supersolar metallicity. It achieves a midplane dust-to-gas ratio of μ0 = 20.3—large enough to exceed the Toomre threshold in a disk that has twice the gas content of the minimum-mass solar nebula (F = 2 in Equation (10)).

Figure 6. Snapshots of settling dust computed with the full procedure of Section 2 which combines the 1D and 3D codes, for the case of 4× bulk solar metallicity. Elapsed time is marked by f, measured on the same timeline characterizing Figures 1 and 2. The shapes of the profiles and their relative spacing in time do not depend on the absolute elapsed time; in this sense the evolution is not sensitive to ρs, F, and s. Vertical gridpoints from the 3D code are plotted as dots. Dust begins well mixed with gas at μ = 0.06 and ends in the marginally stable state with midplane μ0 = 20.3. The midplane density in this last state already exceeds the threshold for Toomre instability in a disk with twice the gas content of the minimum-mass solar nebula (Equation (10) with F = 2).
Download figure:
Standard image High-resolution imageThe evolution of the metal-rich disk over the course of a total of 21 iterations—some of which are sampled in Figures 7–9—is similar to that of the solar metallicity disk, with two notable differences. When the unstably stratified pileups of dust collapse (iteration #4, shown in the top row of Figure 7), enough dust is transferred to the midplane that μ attains an appreciable maximum there. This bump contrasts with the nearly flat profile seen for the solar metallicity run (Figure 3), and persists at least through iteration #16 (Figure 8). A second difference is that in every KH-stable simulation following iteration #13, the vertical kinetic energy, although it eventually levels off, ends orders of magnitude higher than where it began (Figure 8, and the top row of Figure 9). Some currents and/or turbulence appear to be sustained as the state of marginal stability is approached.

Figure 7. Two successive iterations of our procedure outlined in Section 2, for the case of 4× solar metallicity. From left to right, the panels show a starting dust profile (black curve) settled by the 1D code until its midplane μ0 increases by 30% (red dot-dashed curve). This settled profile is then passed to the 3D code and evolved (blue curve) until it stabilizes (rightmost panel showing how the vertical kinetic energy at the midplane eventually levels off). Top panels show iteration #4 of 21 (equivalently f = 0.22 on the timeline of Figure 6). When the unstably stratified pileups collapse, they increase the dust content of the midplane by ∼35% (top middle panel). The resultant dust profile, settled further in iteration #5 (bottom panels), remains free of instabilities after 10 orbits.
Download figure:
Standard image High-resolution image
Figure 8. Similar to Figure 7 but showing iterations #15 and #16 out of a total of 21 for the case of 4× solar metallicity. Shown are two examples of KH-stable profiles whose midplane vertical kinetic energies end orders of magnitude above their starting values. Every 3D simulation starting with iteration #13 in the metal-rich case shows this kind of sustained motion even though the density profiles may be KH stable according to our criterion.
Download figure:
Standard image High-resolution image
Figure 9. Similar to Figures 7 and 8 but showing iteration #21 in the top panels, in which the marginally stable state is found for the case of 4× solar metallicity according to our standard procedure. The midplane 〈μ0〉 = 20.3, corresponding to a midplane density that exceeds that required for gravitational instability in a disk having twice the gas content of the minimum-mass solar nebula. The same dust profile inserted into a shearing box four times as wide in the azimuthal direction as our standard box and having four times as many azimuthal grid points yields qualitatively the same result (dotted line). Settling still further according to our standard procedure results in KHI (bottom panels), but in Section 4.2 we experiment with a modified procedure that tries to hold off KHI for a while longer.
Download figure:
Standard image High-resolution imageRelated to this second point, we should acknowledge that our standard procedure ignores whatever velocities are present at the end of a given 3D simulation when initializing the velocities of the subsequent 3D simulation. That is, with every iteration, velocities are set anew according to Equation (5), with vertical and radial velocities reset to zero. The assumption we make in our standard procedure is that whatever velocities are maintained in a KH-stable layer do not stop dust from settling at the local terminal velocity vrel. A crude attempt at relaxing this assumption is made in Section 4.2.
4. EXTENSIONS
In Section 4.1 we test the robustness of our results against the size of our simulation box. In Section 4.2 we modify the procedure of Section 2, pushing to still higher dust-to-gas ratios at the midplane and revising our identification of marginally stable states.
4.1. Bigger Box Runs
Box size can artificially affect stability because a given box can only support modes having an integer number of azimuthal wavelengths inside it. Thus, too small a box may be missing modes that would otherwise destabilize the layer. To assess whether our box size is too small, we redo the 3D simulations of our standard marginally stable states (iteration #19 of the solar metallicity case and iteration #21 of the metal-rich case), quadrupling simultaneously the azimuthal box size Lϕ and the number of grid points Nϕ. By increasing both in tandem, we maintain the same resolution Nϕ/Lϕ as that of our standard runs. The results are plotted as dotted lines in the top panels of Figures 5 and 9. For both the solar metallicity and metal-rich cases, the bigger box runs still yield stable layers, just as the standard box runs do. We conclude that our standard box sizes are probably adequate.
This conclusion is a bit surprising when we compare our standard box size to our findings in Paper I. We found in Paper I that those KH modes that most visibly disrupted the dust layer had azimuthal wavelengths between 2.6zmax and 4.3zmax. Our standard choice here for azimuthal box size is Lϕ = 2.91zmax, which at face value means that we are only resolving one wavelength at best of an important mode. However, this simple comparison may not be fair. In Paper I, we studied dust layers characterized by a spatially constant Richardson number. The vertical density profiles there differ somewhat from those derived here. In particular the profiles in Paper I have steep density gradients everywhere, whereas here density gradients are steep only at the edges of the layer. When a layer in Paper I became KH unstable, it seemed to do so everywhere at once, whereas here instability always originates at the edges. We have verified that this is true even for the final iterations leading to our identification of the marginally stable state. Obviously these edges have vertical thicknesses that are smaller than that of the layer as a whole. Since the most unstable azimuthal wavelength of the KHI is expected to be of order the vertical thickness of the shearing layer (e.g., Chandrasekhar 1981), it seems that our standard box sizes here, though small compared to our box sizes in Paper I, permit us to resolve several azimuthal wavelengths of those modes that are most able to disrupt the thin edges.
4.2. Refining the Marginally Stable State Using a Modified Settling Procedure
Using our standard procedure of Section 2, we can only provisionally identify marginally stable dust profiles. The identification is provisional because by settling all dust particles at their local terminal velocities vrel, we wind up with edges so unstable that they also destabilize the midplane. In reality, dust particles at the edge may stop settling because they attain a state of marginal stability first, remaining lofted up by the gas motions they stir up locally, and leaving dust particles near the midplane free to keep settling. In other words, marginal stability may be reached sequentially, starting from the edges and ending at the midplane. Our standard procedure does not allow for this kind of gradual evolution because the 1D code settles all dust particles at their local terminal speeds regardless of their location. In this sense our standard procedure is too blunt because it does not allow for slower settling at the stirred-up edges and faster settling at the quiescent midplane. True marginally stable states should have midplane dust-to-gas ratios even higher than the maximum ones displayed in Figures 2, 5, 6, and 9.14
To remedy this shortcoming, we modify our procedure by applying a weighting function 0 < W(z) ⩽ 1 to each dust particle's settling velocity. Starting with a KH-stable state near the end of our standard sequence of iterations, we continue to let dust particles drift to the midplane in the 1D code, not at vrel(z) but at the weighted velocity W(z)vrel(z). We use either a Fermi function

described by two parameters z50 and zw, or a Gaussian

described by a single parameter zw. The choice of weighting function is somewhat arbitrary; it depends on the shape of the dust profile to be settled and is made case-by-case according to considerations outlined below. The intent of the weighting function is to slow the steepening of density gradients at the dust layer's edges and thereby prevent the edges from destabilizing the entire layer.
We start with the KH-stable profile in iteration #18 of our solar metallicity sequence (black solid curve in the top left panel of Figure 10). The dust layer is characterized by a "core" from z = 0 to z ≈ 0.5zmax over which 〈μ〉 is fairly constant, and an "edge" from z ≈ 0.5zmax to z = zmax over which the dust content drops to zero. Because the instabilities that threaten to disrupt the layer originate in the edge and not the core, we seek a weighting function W(z) that slows the downward drift of dust in the edge but not in the core. At the same time W(z) should not be so strongly weighted toward the midplane that the core disconnects from the edge and opens a local gap in dust content. We find upon experimentation that a Gaussian does not have enough flexibility to meet these requirements for this particular iteration. However, a Fermi function with z50 = 0.005Hg—corresponding approximately to the boundary of the core—and zw = 0.05z50 seems to work well (blue dashed curve in the top left panel of Figure 10). We use this weighting function to settle the dust profile until its midplane μ0 increases by 30% to a value of 2.9 (red dot-dashed curve). This settled layer remains KH stable (top middle and right panels of Figure 10)—unlike the layer settled without the weighting function (bottom panels of Figure 5).

Figure 10. Extended settling simulations using the modified procedure of Section 4.2, for the case of bulk solar metallicity. We start with iteration #18 from our standard procedure (black curve, top left panel). A Fermi weighting function with z50 = 0.005Hg and zw = 0.05z50 (Equation (17), labeled "W" at the top left panel) allows dust near the midplane to settle more than dust at higher altitude. The settled profile attains a midplane 〈μ0〉 = 2.9 and is KH stable (top middle and right panels). Further settling, this time using a Gaussian weighting function with zw = 0.0025Hg, results in KHI (bottom panels). Although the modified procedure enables us to settle beyond the last stable state identified using our standard procedure, the gains are not large enough to reach the Toomre density in solar metallicity disks.
Download figure:
Standard image High-resolution imageIn the new profile settled with our modified procedure, the distinction between the core and the edge is no longer so sharp. Thus, to settle this new profile even further, a simple Gaussian for the weighting function seems to suffice. Choosing zw = 0.0025Hg ≈ 0.25zmax, we attempt to increase the midplane μ0 yet again by 30%, but find the resultant profile to be KH unstable (bottom panels of Figure 10).
Similar results are obtained for the metal-rich case (Figure 11). Using Gaussian weighting functions we are able to push the midplane dust-to-gas ratio μ0 to a new record of 26.4, which is 30% greater than the value attained using our unweighted standard procedure.

Figure 11. Extended settling simulations using the modified procedure of Section 4.2, for the case of 4× bulk solar metallicity. We start with iteration #21 from our standard procedure (black curve, top left panel). A Gaussian weighting function with zw = 0.00132Hg = zmax/12 is used to settle preferentially the innermost layers, which achieve a maximum 〈μ0〉 = 26.4 and remain KH stable (top middle and right panels). Although further gains in μ0 did not materialize (bottom panels, using a Gaussian of zw = 0.00127Hg), μ0 is already high enough that gravitational instability is viable in a disk having ∼1–2 times the gas content of the minimum-mass solar nebula.
Download figure:
Standard image High-resolution image5. SUMMARY AND DISCUSSION
To form rocky planets and gas giant cores, dust must amass in a circumstellar disk. In the classic scenario for forming planetesimals, dust settles vertically toward the midplane into an ever thinner and denser layer that eventually becomes gravitationally unstable (Safronov 1969; Goldreich & Ward 1973). Toomre's criterion for gravitational instability (GI) is satisfied for midplane dust-to-gas ratios (ρd/ρg)0 ≡ μ0 ≳ μ0,Toomre, where μ0,Toomre ≈ 34 for a minimum-mass nebula orbiting a solar-mass star (equation 10; note that μ0,Toomre is nearly independent of disk radius). For comparison, in a disk of well-mixed dust and gas at solar abundance, μ0 ≈ 0.015 (Lodders 2003). Whether dust can accumulate until its density increases by more than three orders of magnitude depends on how turbulent the ambient gas is. Even supposing that gas in certain regions of the disk is not intrinsically turbulent (e.g., because it is too weakly ionized to support the magnetorotational instability), the dust itself may excite turbulence in gas by a Kelvin-Helholtz-type/shearing instability (KHI). The KHI is triggered when the velocity gradient between dust-rich gas at the midplane and dust-poor gas at altitude becomes too large. Barring gravitational instability, dust should settle to a state that is marginally stable against the KHI. The question of whether gravitational instability is viable translates into the question of whether the state that is marginally stable to the KHI has μ0 ≳ μ0,Toomre (this is a necessary but not sufficient criterion for the formation of planetesimals by gravitational collapse; see footnote 5).
In this paper, we sought out such marginally stable states by numerical simulation. Starting with dust well mixed with gas at either bulk solar or supersolar metallicity, we allowed dust to settle vertically until dynamical instabilities prevented the midplane density from increasing further. We tracked the approach to the marginally stable state using a combination of a 1D settling code and a 3D shearing box code, working in the limit that particles are small enough not to excite streaming instabilities (SIs). All the instabilities that afflicted our dust layer originated at the layer's edges, where dust density gradients were steepest. We found evidence for two kinds of instabilities: the usual KHI driven by vertical shear, and the Rayleigh-Taylor instability driven by the weight of piled-up dust. These instabilities were mostly confined to the dust layer's top and bottom surfaces, leaving dust near the midplane free to settle but occasionally speeding up the accumulation of solids by transferring dust from pileups downward. The midplane density stopped increasing when the dust layer became so thin that instabilities at the edges threatened to overturn the entire layer.
Using our standard procedure of Section 2, we attained maximum dust-to-gas ratios of μ0 ≈ 2.45 and 20.3 for the cases of solar and 4× solar bulk metallicity, respectively (Figures 5 and 9). These values are lower limits because in our standard procedure dust particles at the layer's top and bottom faces keep settling until they excite instabilities so vigorous that dust at the midplane is stirred up. In reality, dust at the layer's edges may reach a state of marginal stability and stop settling, leaving dust near the midplane free to settle further. We modified our procedure in Section 4.2 to try to account for this effect, reaching μ0 ≈ 2.9 and 26.4 for the two metallicity cases (Figures 10 and 11). These values are still lower limits because our simulations omit self-gravity. But the correction for self-gravity should be small for the solar metallicity disk, on the order of 10% (∼2.9/34). For our supersolar metallicity disk, the correction for self-gravity might be on the order of unity (∼26.4/34)—although it might also be much higher, as Sekiya (1998) and Youdin & Shu (2002) showed that vertical self-gravity can yield a singularity in μ0.
We conclude that a minimum-mass disk of bulk (height-integrated) solar metallicity orbiting a solar-mass star cannot form planetesimals by self-gravity alone: even neglecting turbulence intrinsic to gas, the KHI would force the midplane dust density to fall short of the Toomre density by about an order of magnitude. Our results make clear what changes to the circumstellar environment would be needed for self-gravity to prevail. To attain the Toomre density in a minimum-mass gas disk, the bulk metallicity would need to be enhanced over solar by a factor of a few ≲4. For disks with total mass (gas plus dust) greater than that of the minimum-mass solar nebula, the required degree of metal enrichment would be lower.
Our results agree with those of the prescriptive model of Weidenschilling (2006), who found that the density of millimeter-sized particles (τs ∼ 0.001) at r = 3 AU in a disk for which ρg = 1.6 × 10⁻⁹ g cm−3 (F ≈ 1.3) and Σd/Σg ≈ 0.015 (solar metallicity) fell short of the Toomre density by about a factor of 10. When the bulk metallicity Σd/Σg increased to 0.054, the Toomre density was exceeded by a factor of 3.
5.1. How Spatially Constant is the Richardson Number?
In Paper I, as in previous works (Sekiya 1998; Youdin & Shu 2002; Youdin & Chiang 2004), all dust profiles were assumed to have spatially constant Richardson numbers Ri. The dust profiles we have computed are free of this assumption, whose validity we can now test.
We calculate Ri(z) for our marginally stable states, derived under both standard (Section 2) and modified (Section 4.2) procedures. To compute the numerator (Brunt frequency) of Ri in Equation (4), we use the horizontally averaged dust-to-gas ratio 〈μ(z)〉, computing derivatives using centered differences and assuming the gas to obey a Gaussian density profile (see footnote 9). To compute the denominator (vertical shearing rate) of Ri, we also use 〈μ(z)〉, inserting it into Equation (5) and computing therefrom the velocity derivative. Of course we could also compute the denominator more directly by using the simulation output itself for vϕ—this alternative approach turns out to give identical results for the solar metallicity disk, but for the metal-rich disk the Ri(z) so generated varies much more erratically. As noted in Section 3.2, the metal-rich disk sustains gas motions well above those we put in as seed noise. These motions are not strong enough to overturn the dust layer but they are large enough to render Ri highly variable, both in time and space. By not using the simulation data for vϕ(z) and relying instead on the better behaved 〈μ(z)〉, we effectively average Ri in time and space.
Results for the solar metallicity runs are shown in Figure 12. We plot Ri only where 〈μ〉-gradients are large enough to be computed reliably—thus we avoid regions closest to the midplane. Although we find that Ri is not a strict constant, it varies only between 0.1 and 0.3 within a large fraction of the edges of the dust layer—precisely where instabilities, presumably shear-driven, have rearranged dust. This result compares favorably with Paper I, where we found that a solar metallicity disk has a critical Richardson number of Ricrit ≈ 0.2.

Figure 12. Richardson numbers Ri from the marginally stable profile of our standard procedure (top left panel) and from the marginally stable profile of our modified procedure (bottom left panel), for the case of solar metallicity. Vertical dotted lines separate the "core" from the "edges" in the standard profile (top right panel); these dotted lines are extended into the bottom panels for reference. We plot Ri everywhere except where density gradients are too small to compute reliably; thus, we avoid the entire core region of the standard profile, and the midplane of the modified profile. Over most of the edges—those layers outside the dotted lines which have directly experienced instability, almost certainly related to the KHI—the Richardson number varies between ∼0.1 and 0.3. Thus, the traditional assumption that dusty sublayers relax to states of spatially constant Ri receives some empirical support from this figure.
Download figure:
Standard image High-resolution imageEvidence for a constant Ri within the edges of the dust layer is even stronger for the metal-rich disk, as shown in Figure 13. Here, Ri hovers near 0.5 over much of the edges—again consistent with Paper I. See Figure 6 of that paper; admittedly the curve for Ricrit(Σd/Σg) in Paper I needs to be extrapolated to the supersolar metallicity considered here, Σd/Σg = 0.06.

Figure 13. Same as Figure 12 except for the case of 4× bulk solar metallicity. Here the evidence that layers relax to states of spatially constant Ri is even stronger than for the case of solar metallicity. Moreover, the value to which Ri tends in this metal-rich case is higher than for the solar metallicity case: 0.4–0.6 here, vs. 0.1–0.3 in Figure 12. This trend of increasing Ri with increasing bulk metallicity Σd/Σg is the same trend independently identified in Paper I (see Figure 6 of that paper). In the bottom panels showing the marginally stable profile identified using our modified procedure, the bumps near z ≈ ±0.005Hg are probably artificial, a reflection of our imposed weighting function W(z).
Download figure:
Standard image High-resolution imageThe Ri(z) profiles in Figures 12 and 13 differ from those in Figure 3 of Bai & Stone (2010a); see the dashed curves corresponding to their 3D simulations, all of which include marginally aerodynamically coupled particles. These differences support their arguments that their simulations were not afflicted by the KHI.
In summary, the assumption made in other studies that well-coupled particles settle into a layer for which Ri is spatially constant does not appear too bad. This is welcome news, not least because it implies that the final marginally stable states are robust against uncertainties in initial conditions (Section 2). One caveat is that we have not tested this assumption for those regions closest to the midplane, as they could not relax by our method before being disrupted by instabilities at the edges. This is an area where more work can be done; see Section 5.3. Another caveat, supported independently by Paper I, is that the critical value of Ri to which dust relaxes is not unique, but increases with bulk metallicity Σd/Σg. For a solar metallicity disk, Ricrit ≈ 0.2, but for one having 4× solar metallicity, Ricrit ≈ 0.5. This trend has not yet been explained.
5.2. The Super-linear Relation Between Maximum Dust-to-gas Ratio μ0 and Bulk Metallicity Σd/Σg
The degree to which Ri is constant is related to the scaling between the maximum midplane dust-to-gas ratio μ0 and bulk metallicity Σd/Σg. Naively it might be expected that μ0 scales linearly with Σd/Σg—a greater total amount of metals simply yields a proportionately dustier midplane—and indeed a linear relation is implied by our order-of-magnitude estimate in Equation (11). But we did not find a linear trend in our simulations. We find instead that the relation is super-linear: a factor of 4 increase in Σd/Σg results in a factor of 9.1 increase in maximum μ0 (26.4 versus 2.9).
A super-linear trend is predicted by theories assuming a constant Richardson number (Sekiya 1998; Youdin & Shu 2002). The large gain in midplane density afforded by a comparatively modest increase in bulk metallicity is partly what makes planetesimal formation by gravitational instability so attractive. Increasing Σd/Σg does more than just increase the total amount of metals in the disk—it also helps to stabilize it, by decreasing the vertical shear ∂vϕ/∂z. In the limit μ0 ∼ (Σd/Σg)Hg/Δz ≫ 1, where Δz is the dust layer thickness, we have from Equation (5)

which decreases with increasing Σd/Σg. By comparison, the Brunt frequency [(g/ρ)∂ρ/∂z]1/2 ∼ [(Ω2KΔz/μ)μ/Δz]1/2 ∼ ΩK hardly changes with Σd/Σg. Thus, the Richardson number increases as Σd/Σg increases; the enhanced stability allows Δz to decrease; and thus μ0 ∝ Σd/Δz scales super-linearly with Σd.
The above order-of-magnitude relations show qualitatively how a super-linear trend follows from the decrease in vertical shear, and the consequent increase in stability, brought about by an increase in bulk metallicity. However, these simple relations are not enough to quantify the super-linear trend because Δz appears to have cancelled out of both ∂vϕ/∂z and the Brunt frequency. This difficulty is avoided in a more formal derivation of the relation between μ0 and Σd/Σg, made under the assumption of constant Ri, as described in Appendix B.
We note further that μ0 scales with the inverse of the radial pressure gradient parameter vmax/cs (equivalently η) in the same super-linear way as for Σd/Σg. The smaller is vmax/cs, the greater is the maximum μ0 attainable; the relation between these quantities is derived under the assumption of constant Ri in Appendix B. Thus, we expect our numerical results for max μ0 (2.9, 26.4) to depend sensitively on our assumed value of vmax/cs = 0.025. (Bai & Stone 2010c also reported that the degree of clumping caused by the SI increased strongly with decreasing vmax/cs.)
5.3. Future Directions
With each iteration of our standard procedure we allowed dust particles to settle at their full terminal velocities, regardless of gas motions evinced in previous iterations. We tried to account for these gas motions in a modified procedure by reducing settling velocities at altitude where dust may have already attained marginal stability. Settling velocities were reduced by weighting functions chosen by eye. This modified procedure enabled us to extend the settling sequence by one iteration but no more. Other weighting functions might allow the sequence to be extended further. Introducing weighting functions earlier in the sequence (rather than at the end of our standard procedure, as we have done), and increasing the midplane density by a smaller increment with each iteration (less than the 30% increment that we have adopted), would allow for a more gradual evolution and possibly permit the midplane to reach still greater densities.
Such a program would be straightforward to pursue but would be subject to arbitrariness in the forms of the weighting functions. A more direct approach would be to abandon our hybrid 1D+3D scheme and upgrade the 3D code to allow for a non-zero aerodynamic stopping time tstop for dust. Then both settling and stability could be tracked within a single 3D code. Similar codes have been written (e.g., Johansen et al. 2009; Bai & Stone 2010b), but their application has been focused on the SI, on particles having ΩKtstop ≳ 0.1 and (model-dependent) sizes upward of decimeters. By contrast, we are interested in the possibility that even the smallest particles, for which 0 < ΩKtstop ≪ 1, undergo gravitational instability. The problem of settling small particles may be coupled to the problem of settling big ones. Even if marginally coupled particles comprise only a minority of the disk's solid mass, the turbulence they induce by the SI may prevent smaller particles from settling into the thin layers required for gravitational instability (Bai & Stone 2010a). Quantifying what is meant by "minority" remains a forefront issue. An efficient scheme for numerically simulating this problem would combine the anelastic methods we have adopted (so that the code timestep is not limited by the sound-crossing time) with an implicit particle integrator like the kind devised by Bai & Stone (2010b) (so that the code timestep is not limited by tstop).
Adding self-gravity would be another improvement. As noted at the beginning of Section 5, vertical self-gravity is expected to increase the maximum dust-to-gas ratio by of order 10% for the case of bulk solar metallicity. For the case of a few × supersolar metallicity, the magnitude of the correction is uncertain. It is probably at least of order unity, but might be much more, given the appearance of an infinite density cusp in those solutions of Sekiya (1998) and Youdin & Shu (2002) that account for vertical self-gravity. At the same time, self-gravity might actually limit maximum dust-to-gas ratios if the fluid becomes gravitoturbulent without producing collapsed objects (Gammie 2001).
5.4. Connection to Observations and the Need for Supersolar Metallicity
Observations have unveiled several trends between stellar properties and the likelihood of planet occurrence. Among the most well known is the positive correlation between the occurrence rate of giant planets and the host star metallicity [Fe/H] (Gonzalez 1997; Santos et al. 2004; Fischer & Valenti 2005). Johnson et al. (2010) provided a comprehensive analysis, using a sample of 1266 local stars to ask whether the trend with metallicity persists across all stellar masses M*. The answer is contained in their Figure 2. The need for supersolar metallicity is clear for M dwarfs (0.2 < M*/M☉ < 0.7), where the average metallicity of the planet-hosting stars is [Fe/H] = 0.4. Metal-rich stars presumably once carried metal-rich disks, and so the planet–metallicity correlation for M dwarfs supports our results, and those of others (Sekiya 1998; Youdin & Shu 2002; Lee et al. 2010; see also Johansen et al. 2009; Bai & Stone 2010a) that planetesimals form much more readily in metal-rich environments. In particular, the data for M dwarfs indicate that a mere factor of 100.4 = 2.5 increase in metallicity above solar substantially increases the probability of planet occurrence. This is consistent with our finding of a super-linear trend between maximum dust-to-gas ratio and bulk metallicity (Section 5.2 and Appendix B).
However, the planet–metallicity correlation weakens systematically with increasing stellar mass (Johnson et al. 2010). For A stars (1.4 < M*/M☉ < 2.0), the correlation is arguably not present. This calls into question the need for supersolar metallicities to form planetesimals. The observations of Johnson et al. (2010) might still be reconciled with gravitational instability if more massive stars host more massive disks, although disk mass would have to scale with stellar mass in a faster than linear way to lower the threshold Toomre density (Equation (10)). The possibility also remains that the observations are not actually a direct or sensitive probe of the theory. The observations concern stellar metallicity, which might at best correlate with the global metallicity of the disk, integrated over both disk height and disk radius. By comparison, our theory concerns the local metallicity Σd/Σg, integrated over height but not radius. This local metallicity (not to be confused with the local dust-to-gas ratio μ) can evolve substantially from its global value, as a consequence of radial particle drifts and photoevaporation (e.g., CY10).
Rather than look to their parent stars for evidence for local disk enrichment, we can look to the planets themselves. If planetesimals can only form in metal-enriched environments, we expect that the resultant planets will also be metal-enriched. Guillot et al. (2006) computed the bulk metallicities of the first nine extrasolar planets discovered to be transiting, all of which are hot Jupiters. The results are listed in Table 1, together with the modeled bulk metallicities of Jupiter and Saturn. All 11 are indeed metal-enriched, by factors ranging from 2–47 relative to the Sun, and 2–20 relative to their host stars. One caveat behind these results is that models of hot Jupiter interiors are subject to the uncertainty over the extra source of internal heat responsible for their unexpectedly large radii (see, e.g., Batygin & Stevenson 2010, who also describe a promising solution). To inflate planetary radii, Guillot et al. (2006) included in each hot Jupiter model an additional source of power equal to 0.5% of the received stellar irradiation (Guillot & Showman 2002). The bulk metallicities inferred from the models depend on the details of this extra energy source. Modulo this caveat, every planet is enriched in metals by at least a factor of ∼2 above solar, which is consistent with our finding that forming planetesimals by gravitational instability requires metal enrichments of this order.
Table 1. Metallicities of Extrasolar Planets (Guillot et al. 2006) and Solar System Gas Giants (Guillot 2005)
| Name | Mplanet | MZa | Zplanet | Zplanet/Z☉b | [Fe/H]* | Zplanet/Z* |
|---|---|---|---|---|---|---|
| (M⊕) | (M⊕) | (MZ/Mplanet) | ||||
| HD209458 | 210 | 20 | 0.095 | 6.35 | 0.02 | 6.06 |
| OGLE-TR-56 | 394 | 120 | 0.304 | 20.3 | 0.25 | 11.418 |
| OGLE-TR-113 | 429 | 70 | 0.163 | 10.9 | 0.15 | 7.7 |
| OGLE-TR-132 | 350 | 105 | 0.3 | 20 | 0.37 | 8.531 |
| OGLE-TR-111 | 168 | 50 | 0.297 | 19.84 | 0.19 | 12.81 |
| OGLE-TR-10 | 200 | 10 | 0.05 | 3.33 | 0.28 | 1.75 |
| TrES-1 | 238 | 50 | 0.21 | 14.0 | 0.06 | 12.2 |
| HD149026 | 114 | 80 | 0.70 | 46.78 | 0.36 | 20.42 |
| HD189733 | 365 | 30 | 0.082 | 5.479 | -0.03 | 5.87 |
| Jupiter | 318 | 10–42 | 0.03–0.13 | 2.0–8.8 | 0 | 2.0–8.8 |
| Saturn | 95.2 | 15–30 | 0.16–0.32 | 11–21 | 0 | 11–21 |
Notes. aThe metal content for each listed extrasolar planet was derived from a model of a planetary interior that includes an additional energy source at the planet's center whose power equals 0.5% of the incident stellar luminosity. bThe solar metallicity Z☉ is taken to be 0.015 (Lodders 2003).
Download table as: ASCIITypeset image
We thank Xue-Ning Bai, John Johnson, Eve Ostriker, Jim Stone, and Neal Turner for discussions, and Tristan Guillot for the data in Table 1. Xue-Ning Bai, Anders Johansen, Jim Stone, and Andrew Youdin provided valuable feedback on a draft version of this paper. We are grateful to Stuart Weidenschilling for an insightful referee's report that put our work into better context. This research was supported by the National Science Foundation, in part through TeraGrid resources provided by Purdue University under grant number TG-AST090079. A.T.L. acknowledges support from an NSF Graduate Fellowship.
APPENDIX A: BACKGROUND DISK MODEL
For numerical estimates in this paper, we adopt the standard disk model derived in the review by Chiang & Youdin (2010). The disk has surface densities


in gas (g) and dust (d). The dimensionless parameters F and Zrel ≡ (Σ/Σg)/0.015, typically of order unity, describe how much total mass the disk has relative to the minimum-mass solar nebula, and how metal-rich the disk is compared with a gas of solar abundances, respectively. The minimum-mass solar nebula (F = 1, Zrel = 1) uses a condensate mass fraction for solar abundances of Σd/Σg = 0.015 (Lodders 2003). Values of Zrel>1 correspond to supersolar metallicities Σd/Σg>0.015. Integrated to r = 100 AU, Equation (A1) yields a total disk mass of 0.03F M☉.
At the disk midplane, the gas temperature, scale height, and density are given by


These are adapted from Chiang & Goldreich (1997), adjusted for a disk obeying (A1)–(A2), orbiting a pre-main-sequence star of mass M* = 1 M☉, radius R* = 1.7 R☉, and temperature T* = 4350 K.
APPENDIX B: THE SUPER-LINEAR RELATION BETWEEN MIDPLANE DUST-TO-GAS RATIO μ0 AND BULK METALLICITY Σd/Σg
We derive μ0 as a function of Σd/Σg under the assumption of a constant Ri. Some evidence supporting a constant Ri was found in our simulations (Section 5.1). The density profile for constant Ri is used in a number of papers (Sekiya 1998; Youdin & Shu 2002; Paper I) and we begin by repeating the result, neglecting self-gravity as we have throughout our paper. The dust-to-gas ratio is given by

where

is a characteristic dust height and vmax = ηΩKr (see Equations (5) and (6)) is a constant equal to the difference in azimuthal velocity between a strictly Keplerian flow and dust-free gas. The dust density drops to zero at

A comment on Equation (B1), in the limit that μ0 ≫ 1: except where μ is nearly constant near z ≪ zmax/μ0 and where it falls to zero near z = zmax, the shape of μ(z) is that of 1/z. This form follows simply from the constancy of Ri. Because the numerator of Ri is approximately constant with μ (Section 5.2), the denominator must be as well: ∂vϕ/∂z ∼ (vmax/μ)/z∼ constant, which implies μ ∝ 1/z. From this we can deduce the super-linear trend between μ0 and Σd/Σg as follows. The integral of μ with respect to z is proportional to the total surface density of dust Σd. Because μ ∝ 1/z, flattening off as z decreases below zmax/μ0, this integral varies as log μ0. Then μ0 ∝ exp Σd, crudely.
More formally, we have

where ρg0 is the midplane gas density, assumed constant because zmax ≪ Hg. The gas density profile always well approximates a Gaussian (see footnote 9), from which it follows that  . Then

Inserting Equation (B1) into (B5), we have

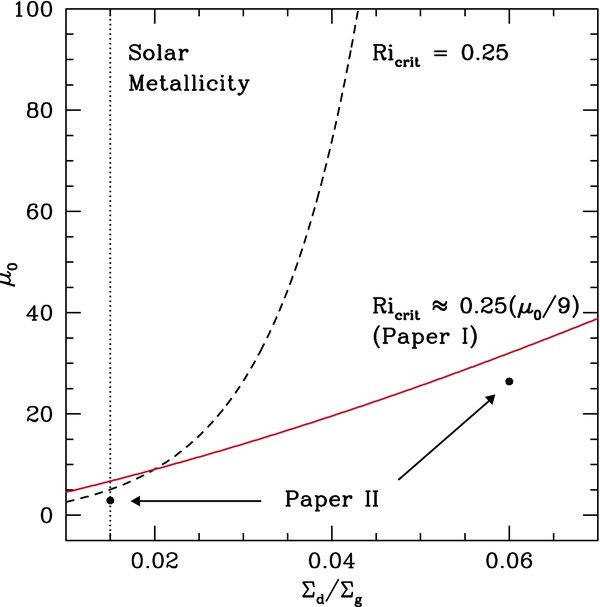
In the limit μ0 ≫ 1, the exponential dependence of μ0 on Σd/Σg is evident. Equation (B6) is plotted in Figure 14, with Ri = 0.25 and vmax/cs = 0.025. Overlaid is the same equation but with varying Ri = Ricrit ≈ 0.25(μ0/9), the relation we found in Paper I (see Figure 5 of that paper). The two data points representing the maximum μ0 achieved in this paper are also plotted. The data track the variable Ricrit(μ0) curve much better than the constant Ri curve.
Figure 14. Super-linear trend between the midplane dust-to-gas ratio μ0 and height-integrated metallicity Σd/Σg for dust profiles characterized by a spatially constant Richardson number Ricrit. Equation (B6) is plotted twice: the dashed curve uses Ricrit = 0.25, whereas the solid curve varies Ricrit according to the relation found in Paper I: Ricrit ≈ 0.25(μ0/9)1.0 (see Figure 5 of Paper I). Both curves fix vmax/cs = 0.025. The maximum values of μ0 achieved in this paper are plotted as points. These data follow the variable Ricrit(μ0) curve more closely than the constant Ricrit curve, corroborating the evidence we found in Section 5.1 that Ricrit is spatially constant but varies with μ0 (equivalently Σd/Σg).
Download figure:
Standard image High-resolution image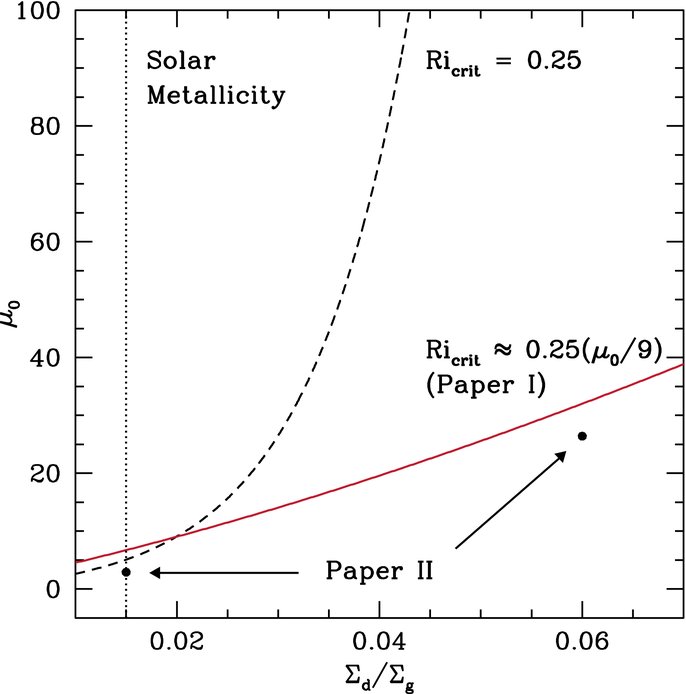
Finally note that Hg/zd ∝ cs/vmax enters into Equation (B6) the same way that Σd/Σg does. Thus, μ0 increases super-linearly with cs/vmax as well. This result leads us to suspect that our numerical results for μ0 (2.9, 26.4) depend sensitively on our choice for vmax/cs = 0.025. In this paper, we did not run simulations with different vmax/cs and so did not test this suspicion.
Footnotes
- 5
Even if the Toomre density is attained so that marginally bound clumps of dust and gas form in Ω−1K time, continued collapse of dust is not guaranteed. For dust to concentrate further, it must sediment to the centers of the gas clumps over timescales tsettle ≫ Ω−1K. During this time, the dust clumps are susceptible to erosion by gas streaming or turbulence (e.g., Cuzzi et al. 2008).
- 6
Strictly speaking, the Toomre criterion for gravitational instability is derived for two-dimensional disks characterized by surface densities, not volume densities (Toomre 1964; Goldreich & Lynden-Bell 1965). To derive our Toomre volume density, we assign a half-thickness to the disk equal to c/ΩK, where c is the velocity dispersion of the dust + gas mixture. This assignment is not rigorous; see CY10.
- 7
The assumption that all metals have condensed is valid only for temperatures T ≲ 41 K. For 41 K ≲T≲ 182 K, methane ice sublimates and Σd/Σg ≈ 0.78 × 0.015 (Lodders 2003; CY10). For our fiducial disk described in Appendix A, T ≲ 182 K for r ≳ 0.4 AU. For T ≳ 182 K, water and other ices sublimate and the maximum Σd/Σg ≈ 0.33 × 0.015. Reductions in Σd/Σg due to sublimation may be offset by radial pileups of dust.
- 8
The Roche density is that required for a fluid satellite to be gravitationally bound against tidal forces exerted by a central body. It is greater than the Toomre density by a factor of ∼7π, and is the more appropriate threshold density for the highly localized clumps of dust created by the SI.
- 9
Actually the calculation of ρg(z) can be neglected to good approximation, as the hydrostatic gas density deviates only slightly from a Gaussian throughout the evolution. Even when μ ≫ 1 near the midplane, Δρg/ρg ∼ (z/Hg)2μ, which for our parameters remains much less than unity. In fact, the gas density is practically constant once the dust falls to z ≲ 0.1Hg.
- 10
These choices imply that every zmax length in the r and ϕ directions is resolved by 22 grid points. In the z direction, we need Nz = 128 points to achieve comparable resolution because the vertical grid differs from the horizontal grid (see Section 2.4 of Paper I). As discussed in Section 4.1, we test the robustness of our results to box size by using bigger boxes as the marginally stable state is approached.
- 11
The transfer of μ(z) from the 1D code to the 3D code involved some smoothing because the vertical grid for the 3D code is ∼10× coarser than that of the 1D code. We captured all features of the 1D dust profile ρd(z) to within ∼10% for z ≲ 0.8zmax. Fractional errors generally increased away from the midplane and were largest at zmax where the dust content goes to zero.
- 12
This value of vmax coincides with the standard value from Paper I, although technically the minimum-mass disk model in Appendix A gives vmax/cs = 0.036. Both values of vmax correspond to cool disks passively heated by their central stars (e.g., Chiang & Goldreich 1997). Smaller vmax results in thinner and denser dust layers and thus promotes the formation of planetesimals. See Section 5.2 and Appendix B for how our results depend on vmax.
- 13
This marginally stable state will be superseded by the marginally stable state identified under an improved scheme in Section 4.2.
- 14